Presenting PLDS
- Philip Sampaio
- October 18th, 2021
- phoenix, live dashboard, plds
Phoenix LiveDashboard is helping teams to quickly visualize and identify problems in systems running in production. It has a beautiful interface and can be plugged to any Phoenix application out there.
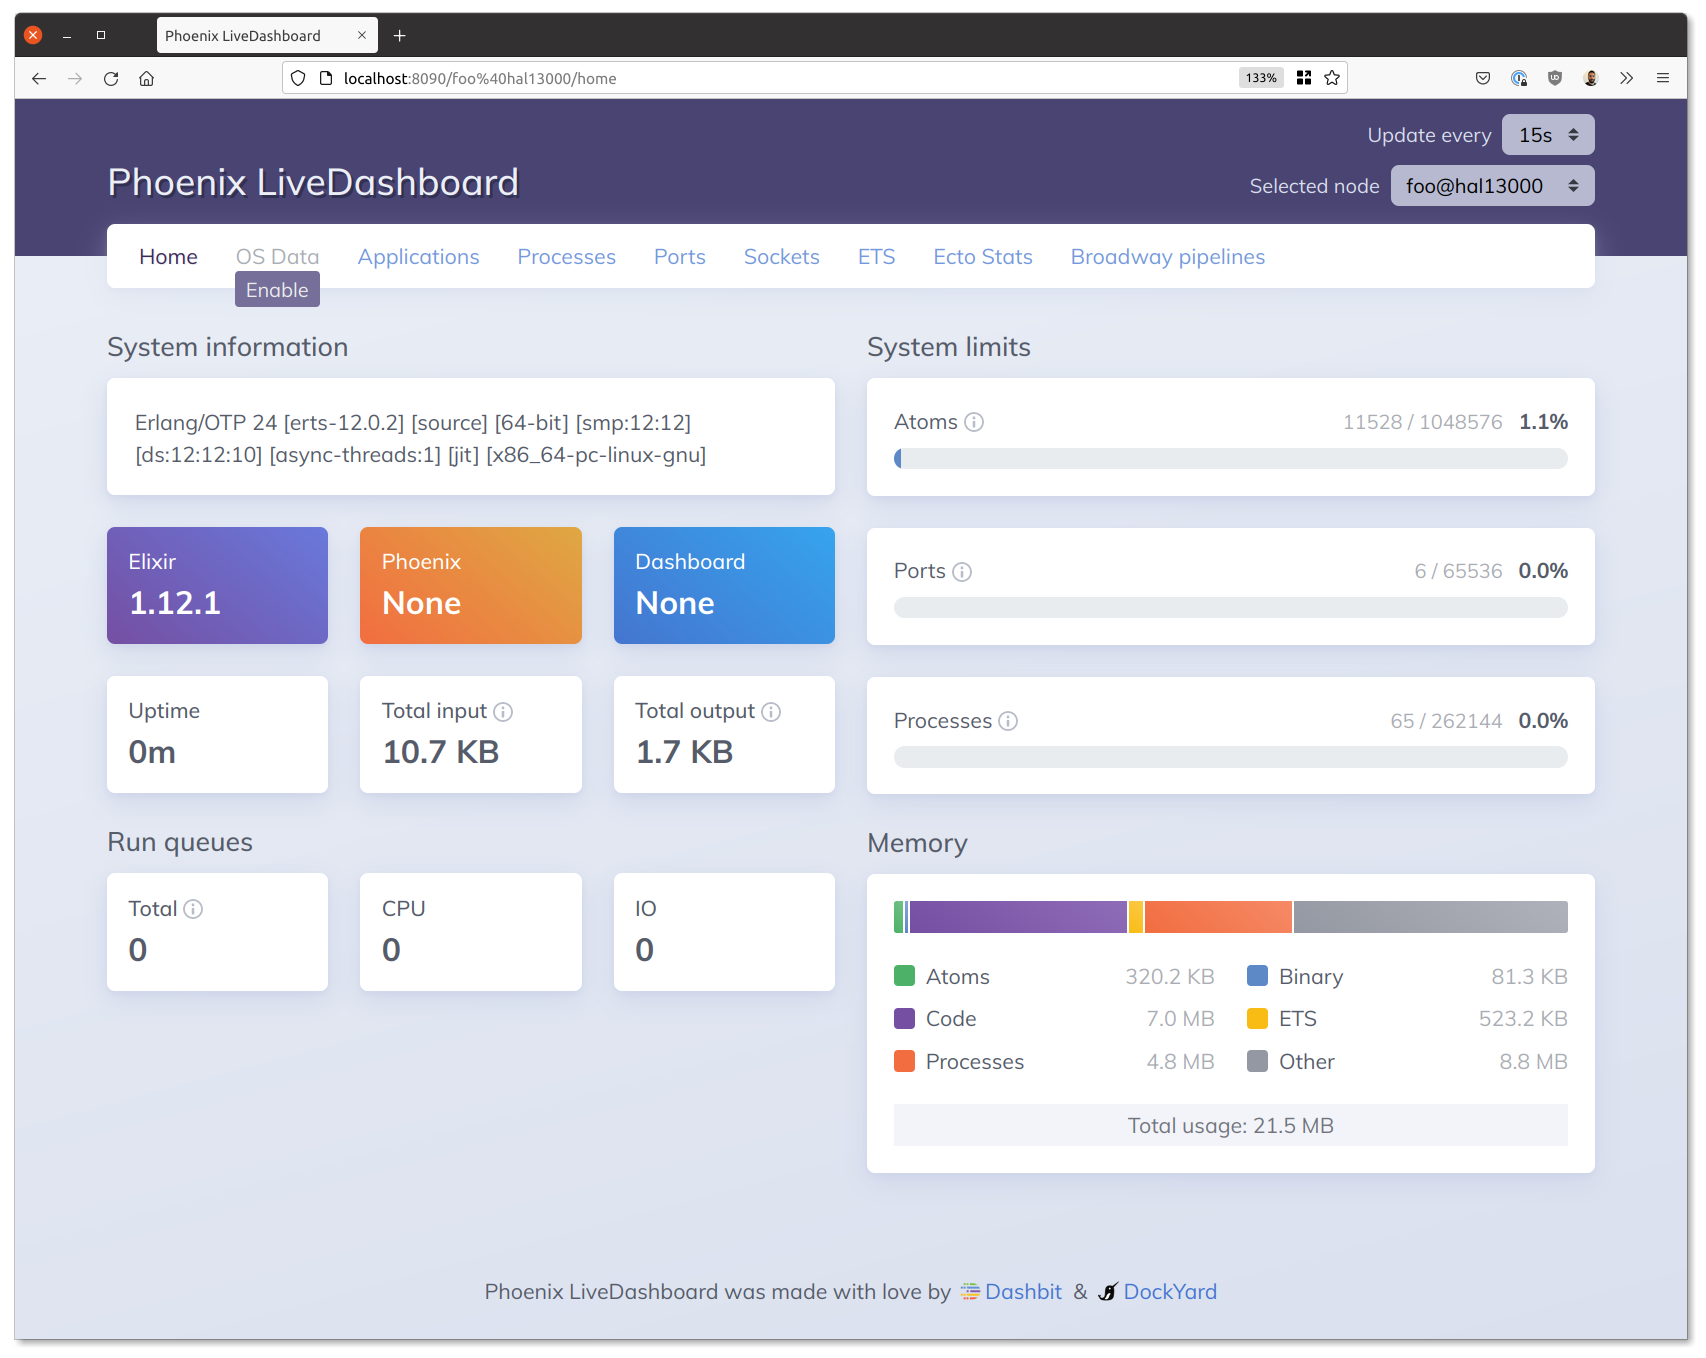
Until recently you could only install LiveDashboard within Phoenix apps. Now that changes: let me introduce you to PLDS - Phoenix LiveDashboard Standalone.
PLDS is a command line tool that brings LiveDashboard to a broader public. It can be used to access
remote systems if they can be reached from localhost.
PLDS usage is similar to using :observer, and only requires a browser and Elixir installed on your localhost.
Suppose that you have a node running on a remote machine and you want to inspect it, but that system doesn’t have Phoenix nor LiveDashboard installed. You can connect to it using PLDS like this:
$ plds --connect name@host --cookie mycookie --openThis command will attempt to connect to the node and open the browser in PLDS.

Fantastic, right?! With PLDS you can inspect the supervision tree, the VM information, machine resources, Ecto repositories, Broadway pipelines and more.
Here is a quick video demonstrating the inspection of a node that is running our Broadway RabbitMQ example app:
The connection bits
It’s fairly easy to connect when both machines are in the same network with no firewall rules preventing communication between then. But this can be trickier when you are accessing a system that sits in a remote network because they will not be accessible from the internet for security reasons.
Having SSH access to the machine running your remote node you also have the possibility to access it by doing a port forwarding of at least two ports: the EPMD - the Erlang port manager daemon - and the node you want to connect to.
Discovering the ports
The easiest way to discover which ports you need to forward is by SSH into the remote machine and running epmd -names. If you are running a release that has the Erlang Runtime System (ERTS) included then you can find epmd at your_release/erts-VSN/bin/epmd.
This command is going to return the EPMD and the node port:
$ epmd -names
epmd: up and running on port 4369 with data:
name myapp at port 45193
In our case, epmd is running in its default port, 4369, and myapp is running at 45193.
Forwarding ports
To make this work first you need to stop the epmd instance running on your localhost if any. Running $ killall epmd is almost guarantee to work, but you may need to run $ systemctl stop epmd.socket depending on your OS.
After that you can forward the two ports from the previous section. In my case I need to forward 4369 and 45193:
$ ssh user@remote-server -L4369:localhost:4369 -L45193:localhost:45193Done! Now you can connect to your remote machine like it was in your local network with PLDS. Remember to get the name and the cookie of your remote node.
Conclusion
PLDS can be helpful for debugging and observing systems running in production - systems with limited machines like those running Nerves can spare resources if we opt for not installing LiveDashboard and run PLDS.
We hope you enjoy the tool! For details, see https://hexdocs.pm/plds/.
