Broadway 1.0 released with a new dashboard
- Philip Sampaio
- August 30th, 2021
- broadway, broadway dashboard
Today we are happy to announce the first stable version of Broadway!
Broadway is around since 2019 and is helping teams ingest and process data from a variety of sources like RabbitMQ, Amazon SQS, Apache Kafka, and Google Cloud PubSub. It initially launched with the following features:
- Back-pressure: the ability to process only what the system can handle at time
- Automatic acknowledgements
- Batching of messages
- Automatic restarts in case of failures
- Graceful shutdown of the pipelines
Throughout the last several months it gained some cool new features:
-
Testing is easier with
Broadway.DummyProducerand new test helpers - Partitioning of messages across processors and batchers
- Rate-limiting to control the inflow of data from the producers (when you don’t want to overload upstream)
- Granular acknowledgement per message and at any place in the pipeline
-
Dynamic pipelines by supporting processes to be named with
:via - Telemetry events and metadata for better observability
-
New functions like:
-
Broadway.stop/1for gracefully stopping a pipeline manually -
Broadway.topology/1to describe the current topology of a pipeline -
Broadway.all_running/0returns all running Broadway names in the current node
-
Broadway now has its own logo:

As well as a brand new website, designed by Aakash Raj Dahal and developed by Jonatan Kłosko.
Broadway Dashboard
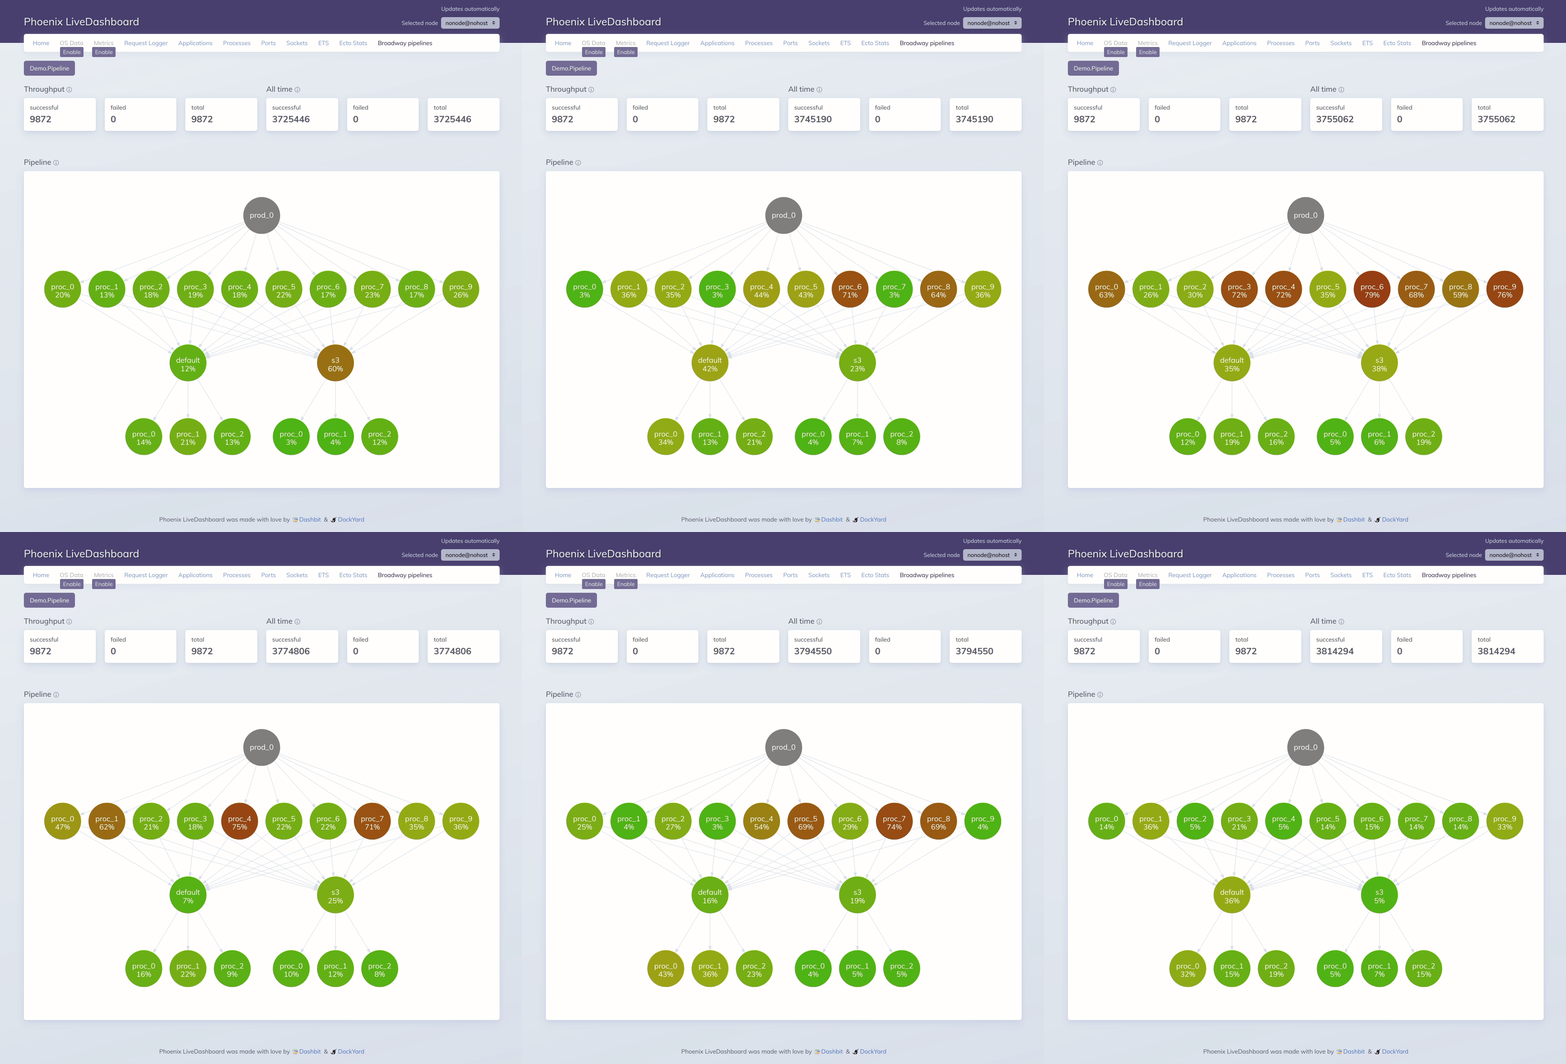
With the release of Broadway 1.0 we also want to announce the release of a brand new dashboard page for Phoenix LiveDashboard that can show all your Broadway pipelines.
The idea of Broadway Dashboard is to be a tool for inspection and experimentation, where developers can play and fine tune the configuration of their pipeline aiming for a higher throughput.

You can see each of the pipeline’s stages represented by a circle, and they turn red when they are busy. The percentage label represents the busy time vs the idle time. This helps team spot bottlenecks in their pipeline.
Marlus Saraiva did an awesome presentation of Broadway in ElixirConf 2019, where you can see the first version of the dashboard working in depth.
This project was born from Marlus’ code and presentation, and couldn’t be done without his amazing work!
Broadway Dashboard also works well in a distributed environment. This means that you can inspect a running pipeline in another node of your system. The only requirement is that they are connected, and Broadway is up-to-date on both nodes. We are also working on a command line version of the Broadway Dashboard, to make it more convenient to inspect your pipelines even if you don’t have Broadway pre-installed.
Conclusion
Broadway API is stable now, which means that the community can focus on bringing more producers to the fold.
Finally we want to say thank you to all the contributors of both projects, as well as of all existing and future producer libraries! You rock!
Stay tuned for more news. Happy hacking!
